Global Ad Growth Was ~+3% During 1Q23 Despite Difficult Comparables
With almost all of the largest sellers of advertising outside of China having now reported their 1Q23 results, I wanted to quantify what happened to the overall advertising industry, and so have produced quarterly estimates of like-for-like growth for the 20 largest sellers of advertising globally outside of those primarily operating in China.(1)
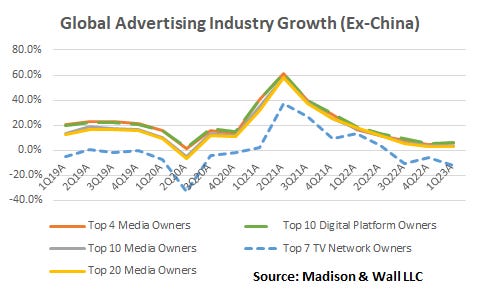
Interestingly – and perhaps surprisingly to those characterizing the current period in negative terms – I estimate that global advertising did, in fact, grow during the most recent quarter, at least for the group I’ve studied here. This group, which represents more than 70% of all advertising, grew by approximately 3% in the first quarter, in line with growth we saw during the fourth quarter of 2022. While it’s plausible these companies have taken some incremental share of the overall ad market as they clearly did during years leading up to 2022, my guess is that it wouldn’t be enough to drive the overall industry to a negative figure.
Most importantly, by analyzing trends on a quarterly basis, the data shows just how much the pandemic skewed growth rates in recent years and how difficult quarterly comparables are impacting results at the present time - arguably much more than the state of the broader economy (which it bears emphasizing, is still growing).
3% growth needs to be placed in context of the year-ago period, which was still benefitting from the same trends which drove the industry’s massive growth in 2021. During 1Q22 this group of companies grew by around 18%, which itself had the unusual comparison of 1Q21’s 32% growth rate.
As we can all appreciate now, there were many companies which emerged through the pandemic and drove significant spending between the spring of 2020 and early 2022, but which are no longer meaningful factors (i.e. crypto or rapid delivery). In that context, 3% growth isn’t all that bad, as it probably reflects what we’ve seen in earnings results from better-established companies: stable growth in ad spending mirroring mid or high single digit revenue growth, with a drag on growth from advertisers who are no longer around.
A second noteworthy observation is that the group of companies included here which focus on television collectively declined by around 13% year over year in 1Q23. I suspect the lack of Olympics-related advertising was only a small factor, as my past research on the topic has generally found that budgets for Olympics come from other TV budgets. In other words, if the Olympics didn’t air, most of the money would still have been spent, and therefore we shouldn’t consider related spending as separate from the rest of TV advertising when assessing growth trends.
As with other advertising, this group of companies also has a difficult comparable, as 1Q22 saw 14% growth. Looking at the data over a multi-year period I note that the current amount of advertising revenue generated by the largest TV network owners declined by an average annual rate of 2.8% from 2019 levels – not far from the general trajectory of decline that we should expect to see for the medium given the broader trends impacting ad-supported TV, such as the general shift of budgets by advertisers away from TV.
Overall, I continue to see these levels of growth as diminished vs. where I expect the full year to play out. Difficult comparables will continue to impact trends in the second quarter, but we should see relatively elevated growth supported by easier comparables in the third and fourth quarters of this year.
(1) The vast majority of these figures are for public companies, with only a handful – TikTok, Apple, and Twitter – requiring estimates or informed guesses for relevant advertising revenue streams. Some, such as Alphabet’s Google, require estimates for the percentage of “advertising” revenue which is attributable to related software rather than media. Most of the US-based companies have some political advertising revenues, which I have estimated and eliminated to make data more comparable across periods. As well, many of the companies have made acquisitions or dispositions which are mostly accounted for here. Finally, for almost every company I also made adjustments to account for changes in foreign exchange. In other words, this data represents like-for-like growth as much as possible.


