TV Upfronts: How To Predict Price Changes
42 Years of Public Data Shows An Old Model Still Works Pretty Well
I’ll be a keynote speaker at the Advertising Research Foundation’s conference AUDIENCExSCIENCE next week (in New York on Tuesday April 25 and Wednesday April 26) where I’ll talk about the future of media and its implications for research and measurement. I hope to see you there!
Over the years I’ve closely watched or participated in US national TV upfront negotiations. Among the things I’ve found most important in predicting pricing are the following:
Historically, buyers and sellers primarily discuss volumes of dollars and prices (while a range of forms of value exchange might be included, total inventory that the network would make available for sale is not necessarily a meaningful part of the conversation).
Negotiations implicitly incorporate the negotiating concept of an “anchor,” or a reference price that largely informs all other prices. I define it as the price changes realized by the network with the greatest dollar volume of inventory to sell (I call that network the “leader” for any given year).
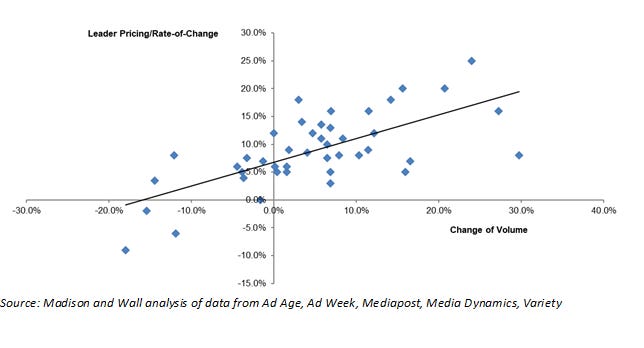
Mapping the most relevant data going back to 1980 using public sources, we can see the following:
Each data point represents one price change for a “leader” with changes in volume for all of prime time. Essentially what this model shows is that if there was no change in volume in the upfront, we would expect a roughly 7% CPM increase (incidentally, the average annual CPM price increase over the 42 years for which I have data has been 9%, while reported volumes negotiated increased by a CAGR of under 5%). Alternately, it takes a 16% decline in volume to produce flat pricing.
One could argue that the industry and the nature of TV negotiations has changed so much over the decades that a model relying on old data is irrelevant. Further, measurement methodology changes, such as the introduction of the People-Meter in the 1980s or C3/C7 in the 2000s could render data from different periods as non-comparable. Certainly I was hearing these arguments back in the 2000s, and I’m sure I’ll hear it after this is published as well.
However, several key elements driving negotiations have stayed the same. Consider the following:
The largest networks continue to individually provide more reach than any other individual suppliers of subjectively-defined premium content. Although diminished in relative terms, collectively national TV broadcast networks remain as the preferred way for most reach-focused marketers to build out media plans which rely on placing sight-sound-and-motion-based commercials next to premium video content
There are only a handful of sellers with comparable inventory (i.e. broadcast network owners, who can satisfy broad reach better than anyone else) who are able to signal intentions to the market, have similar employees and have similar compensation / incentive structures. They can see all of the demand for any of their inventory from all sources of demand but are also relatively indifferent regarding who gets their inventory
There are a slightly greater number of buyers who are much more fragmented in their decision-making (because marketers need to “ok” choices, if nothing else), and none have a complete view of any seller’s book-of-business. They also are relatively specific / non-indifferent about where they want to buy.
All of this has been true for the entire period under analysis. I do believe that the massive rate of decline in pay TV penetration and the rise in viewing of ad-free SVOD services could alter the utility of this historical model, as growing numbers of advertisers could meaningfully alter how they define and budget for television very soon. Of course, individual advertisers can always find alternative strategies to improve their own outcomes (I wrote about one approach here several years ago) but in aggregate, they mostly haven’t change how they use TV ad inventory from year-to-year, and I don’t think there will be any changes in this upcoming season either.
After maintaining and publishing this data during much of my time as a sell-side analyst in the 2010s, I decided to update it this week to see how the model is working.
According to data tracked by Media Dynamics and Variety, in 2019 we saw a roughly 6% volume gain and 14% increase in pricing for the “leader.”. 2020’s pandemic driven-decline produced a roughly 14% decline and 4% price increase. 2021 posted a 7% gain in volume but 16% price increase, while 2022 saw a roughly 6% volume gain and a 10% price increase. Looking at the data against all comparable data points from the past 42 years, a straight-line model shows that in three of the four years the model would have predicted pricing within a couple of percentage points, with one year – 2021’s gangbusters post-pandemic spend-a-thon – coming in with pricing around 6% higher than the model would have predicted.
All things considered, I think the model still generally works, and should once again for this year at least.
To predict the anchor’s price changes, the most important variable is then only a matter of forecasting what the change in negotiation volumes will be, although doing that may be a post for another day.


